How to understand open-question employee feedback

Large organizations have vast amounts of employee text feedback that so-far they’ve done little with. Often this information is the most valuable part of a questionnaire or survey yet understanding it at scale has historically been hard and time consuming.
The process of understanding this feedback is known as ‘coding’. What a good qualitative researcher is trying to do is to identify a set of categories that both cover as many of the comments as possible yet not so many that they become hard to navigate and understand.
The importance of the question and organization context
Feedback does not necessarily come in beautifully crafted sentences. The understanding of any answer to a question is highly dependent on the question asked. People write answers assuming that you know the question asked and view the feedback through the lens that this context provides.
Given this it makes sense that to develop a set of themes from the answer to a specific question it has to be done in the context of the question asked. General models are hard to make accurate. It’s why great text analytics models typically have narrow domain use.
In organizations you also need to understand the context of the organization. Organizations develop their own language use. Many times this is internal jargon, project and technology names. Sometimes it’s re-purposing words to have a different meaning. The employees of one of our clients talks about ‘payroll’ when most people talk about ‘headcount’ (because if they have more money for pay they can afford to take on more staff). Really good models need to learn this language use.
Themes not topics
A good set of categories should be understandable without needing to read the underlying comments (though of course you will likely want to let users drill down to these if they wish). The theme labels need to be sensible answers to the question asked.
If we look at typical categories that survey tools are starting to provide in their text analytics, if the themes are simple, one-word nouns then users will almost certainly have to read the comments to understand what it is about that topic that they are discussing. Noun-only topics are good for navigation - guiding the user to read a subset of comments - but poor at providing insight.
For helping drive decision making what is needed is contextual understanding about what it is about that topic which is of interest. So instead of ‘Communication’ we need to describe that it is ‘more regular communication’, ‘less communication’, ‘more transparent communication’ etc.
It is quite common in our analyses that we’ll find conflicting themes within a particular topic. We’ll find that some employees want ‘more hours’, some will want ‘less hours’ and another group will talk about ‘more consistent hours’. If you’re just looking at the topics - ‘hours’ - all of these themes will be grouped together. To take action you need to understand the context.
Semantic understanding rather than keywords
Early text coding systems used keywords to identify topics. You can even do this with a simple spreadsheet application like Excel. Wordcloud applications typically use this approach.

Wordclouds provide very limited insight.
What is important when creating good themes is to use a semantic understanding of the comment, not just look for certain words. So an employee might ask for ‘more pay’ or ‘better wages’ or a ‘salary increase’. To a human reader these would all fall into the same theme. Our algorithms even recently allocated ‘ha ha, a raise’ to be about improving pay.
The bar for usefulness is quite high
When creating a good set of categories of it’s hard to be useful until you get to a stage where you’re able to identify most of the useful themes and that these themes are summarisations of the text they contain.
We’ve found from clients that the level of coding accuracy has to be high before it’s seen as valuable. In our instance, where we’re trying to replace quantitive, closed scale questions with open-questions it’s important to have good quality themes that accurately reflect the semantic and contextual meaning of the answers.
Whilst providing a list of topics might seem a good first-stage approach, the reality is that it doesn’t replace reading the comments and therefore doesn’t add much value.
Deductive and Inductive coding
There are two general approaches to doing a coding - deductive and inductive.
Deductive coding starts with a predefined set of codes. It’s what most employee engagement apps and even consultants typically use. You start with a model of what people will likely say and then you allocate their topics to these categories.
There are a few advantages with deductive coding:
- You know that you will identify comments in the themes in which you are interested
- It’s easier to compare results across different organizations
However there are several key issues:
- You might miss key themes. From our experience, about 30% of topics from a typical employee question might not fit into a general model
- The coding model has bias as the themes are based on an analyst’s model, not the views of the employees
- It takes more time / resources up-front to decide what themes to look out for
- A model really only performs well with one specific question
The alternative to deductive coding is inductive coding. With inductive coding you start from scratch, using the data as the source of the themes. With inductive coding you can understand the answers to any question.
The typical process for creating an inductive code manually is:
- you read some of your responses
- you identify themes (codes) that cover this sample
- you code your all of your responses to these themes
- you identify the comments you weren’t able to code and identify new themes
- you then recode all your responses again against the new full set of codes
- this whole process is repeated until it’s not possible to identify new, useful themes.
This is, at a high level, how we create the themes with Workometry, apart from instead of doing it all manually a set of algorithms helps with the coding.
Balancing accuracy and coverage
In any predictive model the analyst has a choice between false positives and false negatives. In the case of text classification, if you want to increase the accuracy of your coding (reduce false positives) you increase the risk that you’ll miss some comments in your themes (increasing false negatives).
Our experience of text coding is that readers are much more sensitive to a comment being misclassified than they are about being said that it hasn’t been coded. As a human we tend to be much more understanding if someone says ‘I’m sorry I don’t understand’ to them answering the wrong question. The inductive coding process is iterative to try and create the needed balance.
Whilst coding might seem to be a task which everyone can perform even humans find it difficult. Several studies have shown that when you get several skilled coders to theme the same piece of text you'll only get agreement about 80% of the time. Consistency is even problematic at the individual coder level as their opinions will change as they review more feedback. AI-based solutions will be more consistent than a skilled human.
With volume you get granularity
We often get asked ‘how many different topics will you find?’ The answer is almost always ‘it depends’.
However there are two key factors that it depends on: the question and how many answers that you receive.
With the question one of the big determinants is whether you’re asking a ‘what is good’ or ‘what could be improved’ type of question. Typically you’ll find less different themes in the former than that latter.
To understand the likely number of themes it’s worth understanding how the volume of responses matching a theme tend to be distributed.
If you plot the frequency of mentions for the different themes in your question and order the themes largest to smallest you tend to have an exponential-type distribution.

How often a theme is mentioned will have an exponential shape when sorted most to least popular.
If instead of plotting the number of mentions for each category you plot the logarithm of the number of mentions the curve becomes very close to a straight line. The area under the curve represents the total number of mentions.
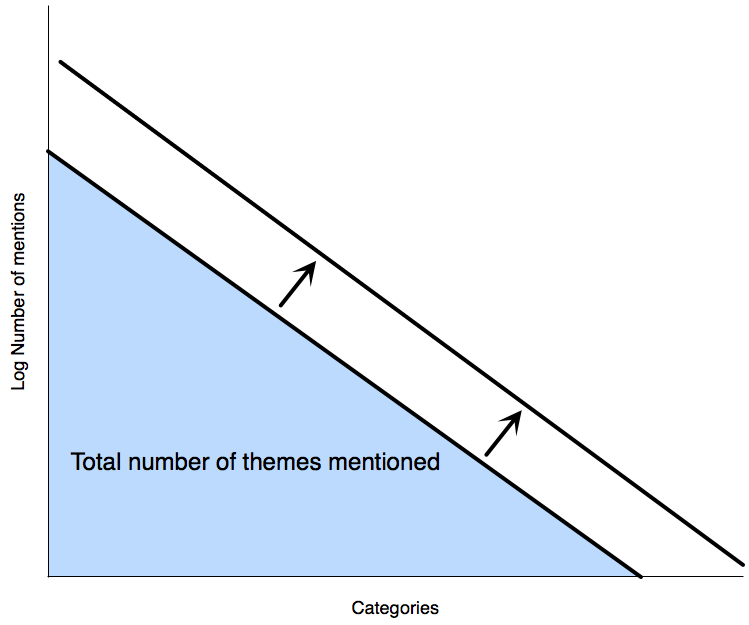
The relationship between the number of comments and the number of themes identified
As long as the number of themes per answer stays the same as you increase the volume of answers then the effect of this is that the curve representing the relationship moves out as shown. The implication of this is that both the mentions of any theme increases and the number of themes identified increases.
Another way of thinking about this relationship is that as you get more comments you start being able to see further down the ‘long tail’ of theme groups.
Combining with other data
Understanding the themes within the data is important but where it starts to really come alive is when you start looking at where the use of certain themes is particularly high or low.
We have an automated detection approach which scans through groups looking for unusual incidents of particular themes.
One example of this would be to understand which themes were unusually likely to be used in various countries or functions. Often the theme might be expected (eg finance people talking about the finance system) but in other instances it might reveal areas for further exploration. We believe that managers should be managing exceptions.
Another use is to identify which themes are closely related to each other - ie co-occurrence of themes. For example you’d want to know that if the temperature in the stores was closely related to comments about customer complaints.
If you’ve been asking open question feedback as part of a mixed question type survey you might want to build a model which links the provision of your themes with the scores on various questions. This can help demonstrate what is linked to engagement, for example.
Finally when text is structured it can be included in any other predictive model. You might want to understand the themes that people talk about which later drives attrition for example. Our experience is that these data points are often some of the most predictive variables, and the easiest to action.
How Workometry codes answers
Our Workometry solution uses an inductive approach to coding feedback themes meaning that it can be applied to the answers of any question. We learn the themes for a specific question in a specific organization and can understand multi-language feedback. Regular clients benefit from our ability to learn organization-specific language and embed earlier knowledge in themes.
As an augmented intelligence solution, Workometry scales very well and many clients are dealing with tens, or even hundreds of thousands of comments to any question. Our key differentiator is to be able to build highly accurate, inductive models in a very short time.