The most important analysis you can do with employee pulse surveys

Pulse surveys offer several benefits from traditional, annual or bi-annual surveys. One of the key benefits is that being more regular they offer better options to study changes over time, so called ‘trend analysis’.
Most of the analyses that we see are aggregated - i.e. they look at change at a group level, whether that is at the overall population level or at the level of a business group, function or country.
Much less frequently studied, but we’d argue much more important, is to look at changes at an individual level.
By this we don’t mean that you pore over ‘John’ or ’Sabine’s responses but that you consider the information as panel data. In marketing this is often described as cohort analysis. Either way you’re looking how responses change for groups individuals over time as they share common experiences or perceptions.
Why study change over time?
Many of the things that we care about and study in our workforces involve how individual’s perceptions change over time, how they respond to those perceptions and the effect of experiences in shaping those experiences. We’d argue that much of the interest in employee experience is about managing those changes.
Our own empirically derived mental-model of attrition for example is remarkably similar to the unfolding model of voluntary turnover first articulated by Lee & Mitchell in 1994. In this model attrition is seen as a decision process incorporating 3 different features:
A shock. This is an experience that makes a person consider changing jobs. For example it could be an experience of bullying or a less-than-favourable job review which makes them understand their career will be limited. The shock could, however, be external to the organization. Becoming a parent for example might be a sufficient shock
A script. This is a pre-existing plan. An example of this would be a plan to work for 2 years to build up savings to go travelling
Image theory. These relate to how the individual sees their career developing. It could be a driven by values, goals or strategies to achieve those goals.
Whilst this model explicitly considers attrition, we see patterns that suggest that a similar framework can be applied to many employee decisions in the workforce, including the decision of whether, and by how much, they should apply themselves to going above and beyond in their work.
From a measurement perspective therefore whilst we can try and understand the decision process after the event - for example in exit interviews or surveys - from a predictive perspective it is important to be able to identify what’s happening before the event occurs.
The one of these 3 components which are most controllable by organizations, and most related to employee experiences are shocks. Whilst some employees might respond to a shock by immediately resigning, for many it triggers a sequence of events - for example restarting a job search - which result in the event happening some time later.
What do you need?
As shocks are related to experiences, to understand what is going on we need to understand what those experiences are. The best - by a long way - method of understanding experiences in a pulse survey is by capturing and analysing rich verbatim comments that describe what those experiences were. This is why great experience-focussed surveys rely on open questions alongside a few scale questions.
As well as survey responses, the most important thing that you need to do this longitudinal analysis is a stable ID field for each individual. This is essential so that you can study data at the individual level.
If you’re running your own surveys with tools ranging from Teams, SurveyMonkey or Qualtrics this is easy. You generally have full control of the data you’re collecting. If you’re using an engagement platform like Glint, Peakon or Perceptyx it’s going to be much harder as most of these tools make analysis of the data outside the tool much harder and they make efforts to anonymise the data. (I explored the challenge and offered some suggestions here.)
How to analyse changes to employee engagement over time
With this information you need to calculate individual level changes. So for example as well as an eNPS figure you want to add some data from a calculation of how that score has changed for the individual concerned since the last time. In addition it’s worth adding another variable showing how the measure changed to the next survey - ie what is said before a change.
It is worthwhile calculating the time difference between the most recent set of answers, and the preceding set of answers. This might provide some understanding of the recency of the shock or event.
Now instead of doing your analysis on the level of one variable - eg eNPS - at a single point of time - you analyse what is happening based on the change in perception. For example you might want to look at comparing text answers from people who had a big fall in engagement to those whose perceptions were stable or increased.
What is typical straight after a fall in engagement?
It’s worth looking at the text responses made by employees who have recently had changes in the levels of engagement, or the other key metrics you’re measuring.
One way of doing this is trying to understand topics that are closely related to drops in engagement and comparing them to topics that relate to low levels of engagement.
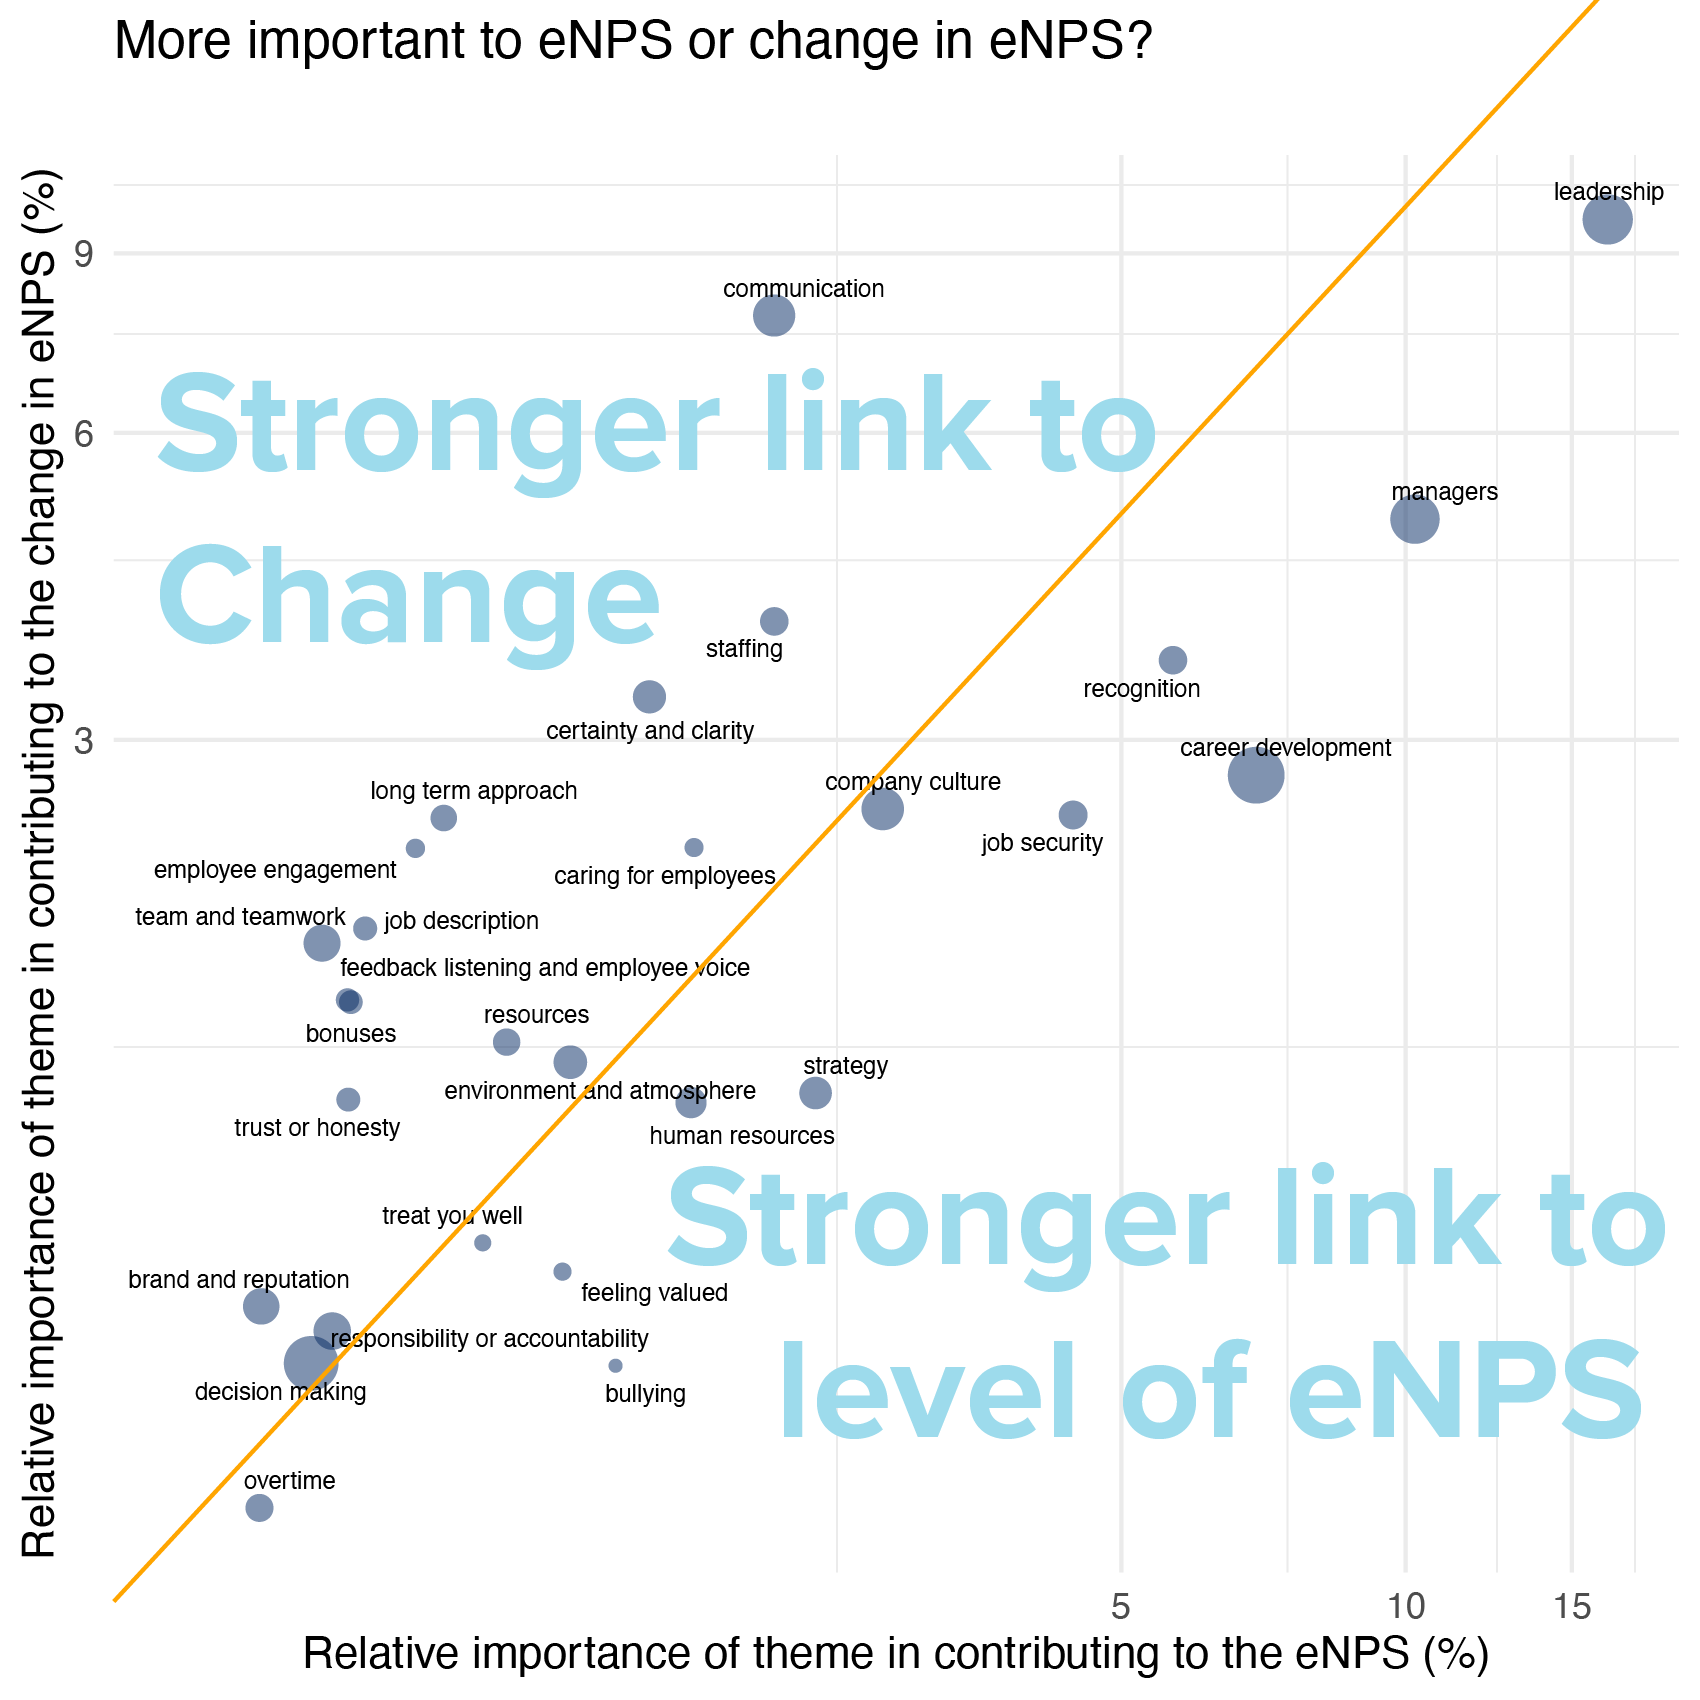
Is mention of a topic linked to falling employee engagement or low levels of engagement?
The image above compares the relative importance of key topics to the level of eNPS to the same topics to the change in eNPS from the previous survey. The questions was ‘what are the cons of working here’. I’ve added an x = y line in orange to show the instances where the effect of the theme is equal. On both the axes the scale is logarithmic due to the distribution of the importance variables. I’ve filtered to just the topics relating to falling or lower-than-average levels of eNPS and just those topics with at least 100 mentions.
What we see employees talking about when they report dropping levels of engagement is often around feeling that they belong and can see a long-term future for themselves in the firm. The communication theme, which is the most important theme apart from leadership in the importance of ‘driving’ the change in eNPS is often linked to certainty, trust and uncertainty. We see in the ‘caring for employees’ sentences such as ‘leadership don’t care about employees, you’re just a number’.
The topics that link to lower levels of eNPS are ones where the issue is more persistent. Complaints about leadership, management and career development endure. They’re all very important for falling engagement, but they’re also topics that those already disengaged (and not further declining) also talk about. Bullying is rare (small bubble) but is rarely forgiven. Human Resources is strongly linked to bullying - the comments typically mention times when an employee took an issue to HR who didn’t do anything.
Of the other topics the one that stands out as different is around staffing. Staffing constraints increase the workloads of those within an area. In the section of the co-occurrence chart based on this answer we see staffing is closely related to workload and retention, but also to topics such as mental health, bullying - the link between staffing and managers is the via bullying.

Section of co-occurrence network showing topics relating to challenges with staffing
Because we’ve added the change in eNPS to each text we can filter on the interactive dashboard to comments of those who have seen a drop in score since the last time. This combination of using Machine Learning & statistical techniques to identify patterns in the data and then using those patterns to guide the analyst to the related answers makes digesting very large volumes of data easy.
What do we see in the survey before an exit or other event?
Another analysis that it’s worth doing it to look at the changes of employees in the pulse surveys before they left. Again, you’re not looking at them at the individual level but instead creating this set of individuals as a group and exploring how their perceptions, and the topics that they mentioned, changed before they left.
Asking a better question
This article has highlighted the benefits and additional insight that can be gained from understanding how individuals’ perceptions evolve over time. It recommends breaking aways from the usual analysis of just looking at absolute levels of engagement (or eNPS etc.) and instead look at how those perceptions develop.
To take this analysis further, given the assumption that you have the text capabilities to understand patterns of answers in a sufficiently granular, the easiest way of improving your understanding of the experiences that trigger those changes is to ask better questions about them.
If we consider the type of question asked above - “what could we do to improve working here?” (or what is negative..) the challenge that we’re faced is that employees provide generalised statements. What they rarely include is the personal experiences that they face. To get at these you need to ask them for the stories directly.