Four ways to use qualitative data in People Analytics

The most successful People Analytics teams that we know combine qualitative and quantitative data to better answer business challenges. This ‘mixed methods’ type of approach can significantly increase the success of a project, however its use is not universal. Some teams either don’t know where to start, or are too eager to jump into analysing the (usually quantitative) data.
For our clients one of the most common forms of qualitative data is open-question text. We help them code this text into themes that describe what people are talking about, and how they mention each theme (plus a lot of additional pattern-spotting in the data). Even if you don’t have the sort of text that is common in a survey - for example you have richer data from interviews or workshops - you’ll probably want to code or theme it as part of the analysis.
To help those wanting to understand how to use qualitative data as robust part of an analysis this article explains 4 common ways that we think qualitative data can be used. We will primarily focus on analysis of text data, especially in surveys, but the same principles with other forms of qualitative data should apply.
Running qualitative and quantitative in parallel
This is the typical approach in a survey, where some questions are closed / scale based (quantitative) and some questions are open (qualitative). Both the qualitative and quantitative data has been collected at the same time.
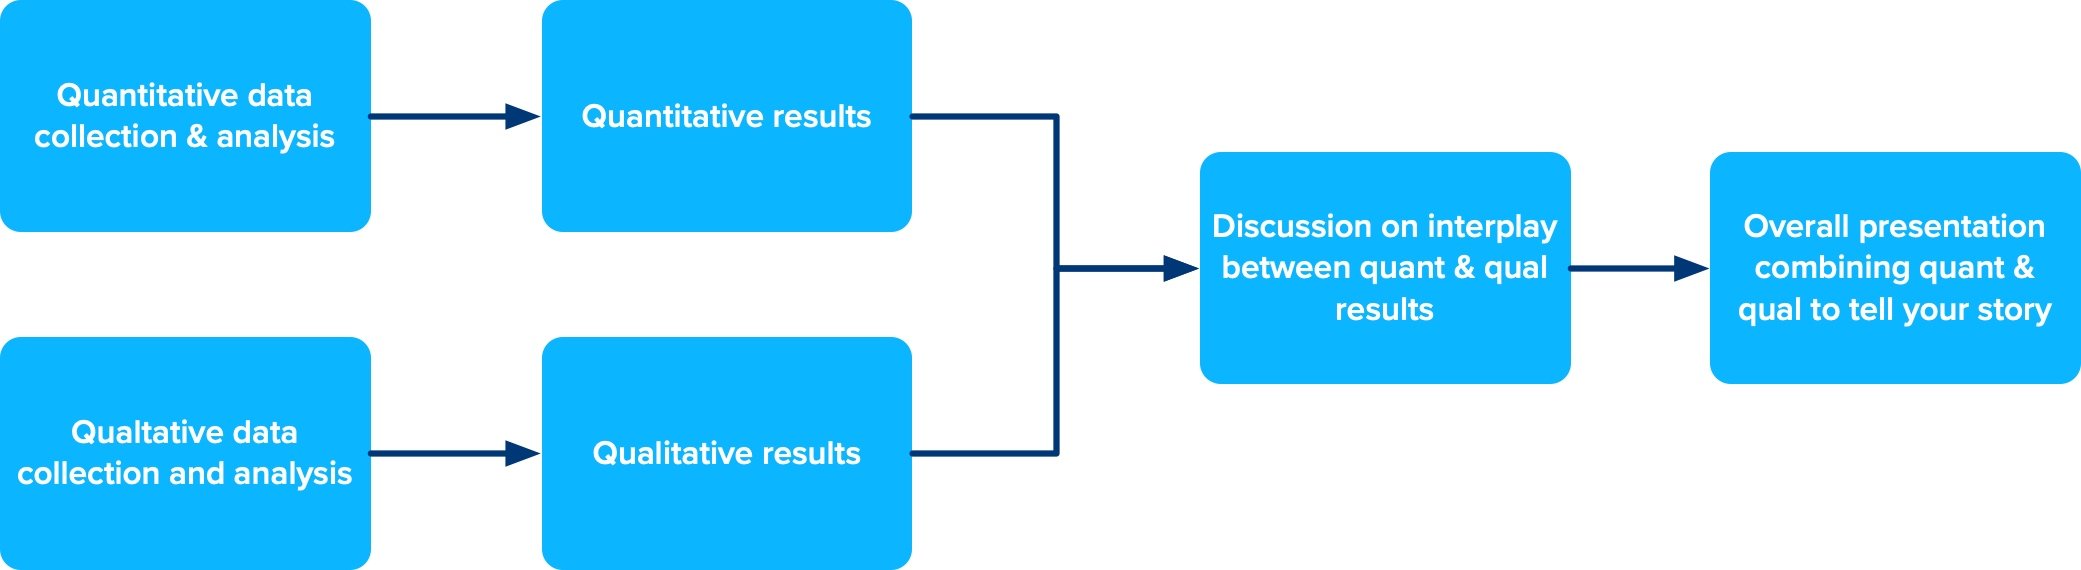
A parallel mixed-method approach, e.g. analysing an employee survey.
In this type of analysis, especially when creating reporting for senior executives, the ideal approach is to use the findings of both of the data types in combination with the other:
To support, or add further detail, to the findings of the quantitative data you want to identify what are the relevant comments in the text data saying? Can we find useful quotes? Can we see the differences between the comments on a particular theme of groups which seem (from the quant data) to be particularly challenged from groups which seem to be reporting more positive outcomes? Which themes in the text are particularly important for ‘driving’ changes in the quantitative question you’re investigating?
For themes / patterns found in the qualitative, open answers, what do we see in the quantitative answers? Is there a difference between different parts of the employees population.
What you need to do this type of analysis is a rapid analysis of the text answers. Interactive dashboards are particularly useful to explore the text answers and drill in to the relevant comments. Text analysis can add various ‘metadata’ which can be used to guide the analyst to the most valuable comments.
A final point on this mixed type of survey is that the qualitative questions give you an ability to identify important issues that are not being questioned in scale questions. An implication of this is that a smaller number of scale questions can be asked increasing the respondent experience.
The best presentations are those that provides equal weighting to the open question responses as to the scale questions.
Explanatory use of qualitative data
In an explanatory use of text data a questionnaire is used to collect additional information that can help explain the quantitative information. That quantitative data could come from an analysis of behavioural data or a predictive model where you can see what is happening but now need to understand why.

An explanatory use of qualitative data
The two most typical cases we see that fit this mode are:
No text was collected in the first instance - for example the quant data comes from a non-survey source or for whatever reason no open questions were asked
Text was created but the answers don’t provide sufficient richness to answer the question / concern of the team.
An example of the second case could be needing more information on processes. Scale questions on processes & supporting technologies are relatively common in traditional surveys. Whilst a general open text question will likely to reveal quite a few mentions about this topic - especially from the most engaged employees - respondents rarely explain in detail which processes or technologies are causing the most frustration.
Of course it doesn’t have to be another ‘survey’. Many firms will use workshops post-survey to explore these themes. This will capture much richer data than a secondary survey, but at the expense of much narrower reach. Of course you could develop an approach to do both!
Exploratory use of qualitative data
A large proportion of our work starts with this approach. We’re often given a historical dataset - for example the last few years survey responses - and use that rich, extensive data to identify potential areas to explore in more detail.

An exploratory use of qualitative data
If we think about the continuum between quantitative and qualitative data & analysis my suggestion is that the qualitative data acts best in an exploratory. The large volumes of text data
So powerful can this exploratory approach be, and so quick it can be accomplished, that it is my default recommendation for how to start almost any People Analytics project. As well as informing data collection it can also help feature selection and what transformations you need to do to your data to incorporate them in models.
Qualitative-driven experimental approaches
If there is a gold-standard this is probably it. The approach is straightforward in concept -
First you use an exploratory approach to develop questions, or highlight the things you’re most interested in exploring.
You then conduct an experiment designed mostly to quantify the effects that you believe are driving the change. For example you might want to quantify changes because you need to produce a business case.
At the end of the experimental period you collect qualitative information to explain why the difference you see between your groups are occurring.
With stakeholders you review both the qual & quant data & agree how to proceed / implement changes.
You continue to collect data to ensure ongoing improvements, effectively restarting the process.
Where to start
How you start incorporating a mixed approach really depends on the use-case or problem that you’ve been asked to address.
For almost all workforce related challenges my first recommendation would be to quickly look into recent survey data to identify people discussing your and related themes. (A good text analysis should highlight which themes are related). The results of this analysis can add considerable value to how you plan the overall project, generating hypotheses and enabling you to focus on the most promising ones.
Company-wide engagement surveys are generally trying to answer multiple questions. It’s therefore highly valuable to analyse both the quant and qual data together. Most of our clients are providing us with the text data as soon as the survey closes. Often we’ve analysed the text before they’ve done the first round of analysis of the scale questions.
For any Employee Experience-related continual listening programme you’ll want to be using an ongoing text-centric surveying approach. This approach will not only provide rich information on the themes that you probably want to understand, but will also show new themes and challenges as they appear.